TLDR;
This YouTube video provides a technical analysis of the stock market's recent performance, focusing on the Dow, S&P 500, and NASDAQ. It discusses key support and resistance levels, potential chart patterns like head and shoulders and double tops, and the significance of moving averages. The video also touches on factors like crude oil prices, inflation, and the Federal Reserve's policy decisions, offering insights into potential future market movements and trading strategies.
- Market indexes experienced declines, with the Dow, S&P 500, and NASDAQ all showing negative performance.
- Technical analysis suggests bearish trends, with key support levels being tested and potential for further declines.
- The video highlights the importance of watching the 200-period moving averages and November lows for potential bounce or breakdown scenarios.
Market Overview and Key Indicators [0:05]
The stock market experienced declines, with the Dow Jones Industrial Average down almost 4%, the S&P 500 down 0.27%, and the NASDAQ down 0.28%. The Russell 2000 was up 0.65%, while the VIX (Volatility Index) decreased by 4.11%, closing at 24, suggesting a potential up day for the S&P 500. Concerns remain about crude oil prices exceeding $119, potentially mirroring the 2008 scenario where rising oil prices preceded a deflationary bust. Crude oil had an initial rally but eased off by the session's end.
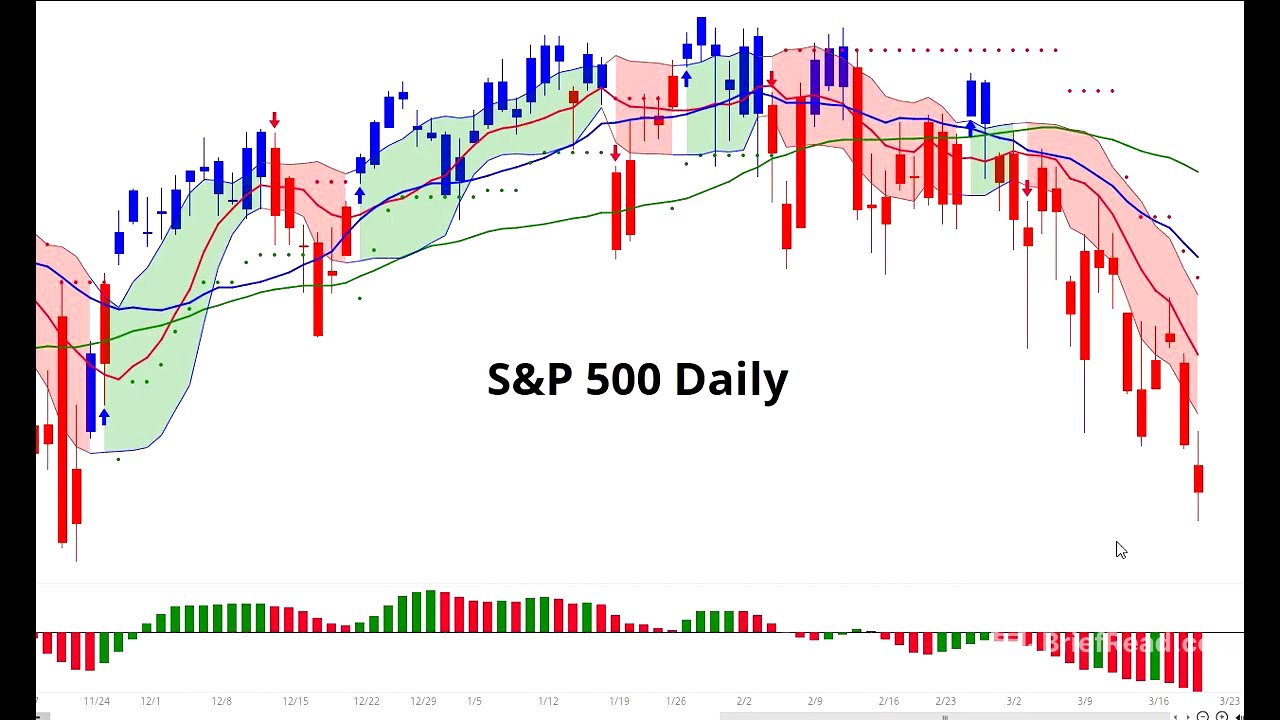
Technical Analysis of the S&P 500 [3:47]
The S&P 500 has broken below a support level from the December low and back-tested it, approaching the 200-period moving average and the November low. A confirmed break of this level, along with a double top pattern, could lead to a move down to the 6150 area, targeting a gap fill around 5300, which aligns with the 78.6% Fibonacci retracement level. Further declines could reach the April low and horizontal support, coinciding with the 200-week moving average and a trend line from the 2020 low. The speaker warns of major resistance and potential for a dramatic drop, cautioning against complacency.
Bearish Signals and Potential Market Patterns [6:24]
Bearish signals persist for the S&P 500 and NASDAQ, with the possibility of breaking the double top confirmation line. A bounce around the 200-period moving average is possible. The speaker points out that the Dow reaching 50,000 acted as a sell signal, with the index now down nearly 10%. Distribution is taking place, which is often confused with consolidation. The speaker discusses the potential for the S&P 500 and Dow to form a right shoulder in a head and shoulders pattern, watching the 200-period moving average and November low.
Dow Jones Analysis and Potential Rebound [10:39]
The Dow Jones Industrial Average has closed below the 200-period moving average for the second time, entering a support area. A potential head and shoulders pattern could form if the index rallies back towards the moving averages, possibly up to the cloud around 48,000. The Dow is currently oversold, with minor divergences developing and a possible bottoming tail. Key resistance levels include the trending cloud, 50-period, and 100-period moving averages. The speaker notes that a drop of approximately 9.5% has created divergences on various indicators, suggesting a potential bounce.
Trading Range Breakdown and Key Levels to Watch [14:59]
The market has broken down from a trading range, taking out the December low. The speaker emphasizes the importance of watching the 200-period moving averages, as they are closely monitored by institutions and everyday traders. If the market fails to move back into the trading range, it could confirm a double top pattern, potentially leading to a move towards the February peak. A move back into the trading range, bouncing off the 200-period moving average, could set up a head and shoulders pattern.
S&P 500 Analysis: Gaps and Potential Right Shoulder Formation [18:21]
The S&P 500 has closed under the 200-period moving average, with a gap filling today but another gap from yesterday remaining. Filling these gaps could lead to a right shoulder formation, potentially reaching the cloud and moving averages. The speaker notes that previous double top patterns in 2022 and 2025 did not form a right shoulder, instead moving down to the 50-week moving averages. Multiple points of divergence suggest a major reversal, with the possibility of forming a larger head and shoulders pattern.
NASDAQ Analysis and Key Support Levels [24:35]
The NASDAQ has dropped nearly 8% from its lower high and is oversold. A hollow red candlestick pattern has emerged, with the index attempting to rebound after dropping below the 200-period moving average. The speaker is watching for a bottom around the November low and potential for a bounce or a breakdown. The 10 and 20 moving averages have dropped below the 50, and the 50 has lost the 100-period moving average, with the cloud acting as resistance.
Monthly Charts and Long-Term Trends [26:43]
The monthly charts are very bearish, with a bearish cross on the NASDAQ's price oscillator. The speaker questions whether the market is headed down to the 50-month and 200-exponential moving averages, confirming double top patterns. A bounce around the 200-day moving averages in the daily time frame, holding above the November lows, is a key level to watch. The speaker emphasizes that a right shoulder formation is not mandatory, but remains a possibility if institutions defend the area.